Carolina Forest Home Market Report

or Create your own market report

Carolina Forest Myrtle Beach Market Report

Active, Pending and Sold — Updated Every 3 Minutes
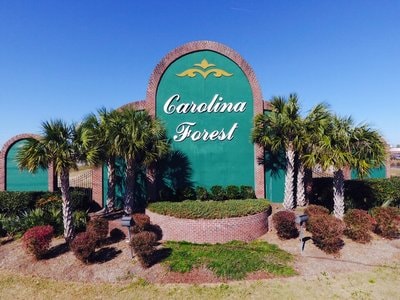
Homes in Carolina Forest, Myrtle Beach

Curious about home sales in Carolina Forest?

Here's a quick list of every sale in the past 6 months complete with up to date pending listings, sold homes, and active homes for sale.

Three tables, and each answers a different question. Active shows you what you are competing against, pending shows what buyers are choosing right now, and sold shows what they actually paid rather than what sellers asked.

Why One Average Will Not Describe Carolina Forest

This is the thing to understand before you read a single row. Carolina Forest is not a neighborhood, it is a 12,000 acre area made up of dozens of them, and homes in it list from the low hundreds of thousands to well past $5 million.

The average at the bottom of the table is not your home

An average that mixes Waterbridge, The Farm, Plantation Lakes, The Bluffs on the Waterway and every other community into one number describes a house that does not exist. Use it to see which way the market is moving, not to price a specific property.

What to do instead: find the rows in your own community, or a community genuinely like it, and read those. A dozen sales on your street tell you more than five hundred sales across the area.

To browse by neighborhood rather than by sale, see the Carolina Forest page, where each community has its own page with its own price range.

How to Read the Columns

  • List price and sold price. Only the sold table shows both. The gap between them, across several similar homes, tells you how much room sellers in that community are actually giving.
  • Cost per square foot. Useful within one community, misleading across the area. A waterway lot and an interior lot at the same price per foot are not the same purchase.
  • Days on market. The quietest number and often the most useful. A home that sold in a week and one that sold after two hundred days were priced very differently at the start.

Put the three together and you have months of supply: divide the active listings by the number selling each month. Under four months favors sellers, four to six is balanced, and over six favors buyers.

Homes and condos in Carolina Forest do not always move at the same pace, which is why they are reported separately. If you are weighing both, run that math on each rather than on the area as a whole. See my Carolina Forest condo market report for the other half.

Let Me Be Your Guide

A market report tells you what has already happened. It does not tell you what is about to be listed, and in an area this size that gap is where most of the opportunity sits.

Call me today for additional off market properties and market insights, and for what these numbers mean in the specific community you are watching.

Call or text Ashley DeLong, REALTOR® at (843) 685-3191 today.

Let's work together.

Buying or selling in Carolina Forest? Ashley DeLong can tell you what these numbers mean for your street rather than for the whole area.

Contact Me! Call Ashley

Active Properties
Address Beds Baths Living ft2 List Price Cost per ft2 DOM
5016 Big Bear Ct. 5 5 5,046 $5,175,000 $1,025 153 days
904 Waterton Ave. 5 4 4,638 $1,849,000 $398 125 days
898 Waterton Ave. 5 6 3,769 $1,785,000 $473 168 days
909 Bluffview Dr. 5 5 3,889 $1,599,900 $411 99 days
901 Crystal Water Way 4 5 3,235 $1,449,700 $448 13 days
840 Waterton Ave. 4 5 3,650 $1,375,000 $376 54 days
449 Saint Julian Ln. 5 4 4,004 $1,374,000 $343 134 days
1315 Ashboro Ct. 5 5 3,583 $1,350,000 $376 196 days
8015 East Bay Ct. 4 5 2,790 $1,347,000 $482 251 days
8658 Windsong Ct. 4 5 3,866 $1,325,000 $342 24 days
516 Oxbow Dr. 5 6 5,506 $1,300,000 $236 14 days
1278 Fiddlehead Way 5 5 4,056 $1,275,000 $314 8 days
1229 East Isle of Palms Ave. 5 4 3,800 $1,250,000 $328 28 days
350 Saint Julian Ln. 4 5 3,675 $1,250,000 $340 492 days
9409 Carrington Dr. 5 6 4,267 $1,200,000 $281 8 days
1176 East Isle of Palms Ave. 5 5 4,221 $1,198,000 $283 53 days
1248 East Isle of Palms Ave. 4 5 3,537 $1,170,000 $330 79 days
993 Crystal Waterway Dr. 6 5 3,611 $1,130,000 $312 98 days
5226 Mt. Pleasant Dr. 5 4 3,781 $1,125,000 $297 177 days
485 Starlit Way 5 4 3,489 $1,095,000 $313 158 days
616 Edgecreek Dr. 4 4 3,888 $1,029,000 $264 267 days
1957 Sweet Olive Ln. 4 5 3,577 $1,025,000 $286 52 days
1011 Bluffview Dr. 4 5 3,000 $965,000 $321 141 days
827 Oxbow Dr. 4 4 4,278 $949,900 $222 106 days
837 Bluffview Dr. 5 5 4,909 $949,000 $193 236 days
9474 Carrington Dr. 4 4 3,707 $945,000 $254 71 days
3142 Marsh Island Dr. 4 4 3,146 $929,999 $295 53 days
950 Bluffview Dr. 4 4 3,214 $929,900 $289 130 days
825 Crystal Water Way 5 5 3,610 $925,000 $256 165 days
930 Bluffview Dr. 4 3 3,202 $914,900 $285 4 days
925 Bluffview Dr. 5 4 3,296 $899,900 $273 169 days
337 Starlit Way 4 3 2,815 $899,000 $319 44 days
969 Bluffview Dr. 5 4 4,198 $899,000 $214 125 days
849 Crystal Water Way 5 4 3,400 $875,000 $257 89 days
1037 East Isle of Palms Ave. 5 5 3,378 $874,900 $258 46 days
7000 Legare Pl. 3 4 3,498 $873,900 $249 91 days
634 Boone Hall Dr. 7 4 4,700 $870,000 $185 28 days
828 Crystal Water Way 6 5 3,384 $862,920 $255 11 days
1136 Fiddlehead Way 4 4 3,250 $850,000 $261 58 days
924 Henry James Dr. 5 5 4,054 $850,000 $209 62 days
1128 East Isle of Palms 4 4 3,333 $850,000 $255 84 days
358 Saint Julian Ln. 4 4 4,031 $849,000 $210 24 days
8013 Wacobee Dr. 5 4 3,650 $849,000 $232 211 days
4020 Captiva Row 4 4 2,716 $843,700 $310 179 days
641 Waterbridge Blvd. 5 4 3,329 $819,000 $246 108 days
847 Waterbridge Blvd. 4 3 2,814 $800,000 $284 14 days
914 Bluffview Dr. 4 3 3,250 $800,000 $246 207 days
8140 Wacobee Dr. 4 4 3,457 $799,000 $231 78 days
878 Sand Binder Dr. 4 3 2,160 $795,000 $368 83 days
8500 Juxa Dr. 4 4 3,254 $789,900 $242 19 days
Average: 3.9 3.2 2,591 $595,254 $222 89 days
Viewing 1 - 50 of 269, only 250 can be displayed.
Properties Under Contract
Address Beds Baths Living ft2 List Price Cost per ft2 DOM
852 Waterton Ave. 5 6 4,666 $2,300,000 $492 66 days
3013 Holly Berry Ct. 4 4 5,424 $1,975,000 $364 162 days
401 Saint Julian Ln. 4 5 3,952 $1,899,000 $480 185 days
369 Saint Julian Ln. 4 5 3,750 $1,425,000 $380 20 days
816 Waterton Ave. 4 5 4,130 $1,375,000 $332 147 days
896 Waterbridge Blvd. 5 6 4,766 $1,225,000 $257 73 days
480 Starlit Way 4 4 3,469 $1,200,000 $345 29 days
8712 Rivolo Ct. 4 4 3,628 $1,150,000 $316 42 days
1289 East Isle of Palms Ave. 6 4 4,023 $1,144,000 $284 76 days
1606 Rachel Carson Pkwy. 5 4 3,939 $1,049,000 $266 46 days
2001 Summer Rose Ln. 4 4 4,090 $935,000 $228 7 days
3058 Vasco Loop 4 4 3,312 $927,710 $280 0 days
8065 Wacobee Dr. 4 5 3,385 $899,000 $265 6 days
315 West Palms Dr. 5 5 3,596 $875,000 $243 13 days
2104 Clematis Ct. 3 4 2,755 $849,900 $308 267 days
914 Indigo Bay Circle 4 4 3,392 $829,265 $244 0 days
883 Indigo Bay Circle 4 4 3,367 $827,965 $245 0 days
906 Indigo Bay Circle 4 4 3,577 $813,185 $227 0 days
444 Starlit Way Starlit Way 4 3 2,815 $794,900 $282 5 days
894 Indigo Bay Circle 4 3 2,622 $778,890 $297 0 days
445 Starlit Way 4 3 1,918 $774,456 $403 0 days
3041 Carmine Loop 4 4 3,392 $763,360 $225 0 days
441 Starlit Way 5 3 3,349 $745,325 $222 0 days
449 Starlit Way 4 3 2,244 $744,460 $331 128 days
3005 Carmine Loop 4 4 3,265 $727,415 $222 0 days
902 Indigo Bay Circle 4 3 2,601 $723,640 $278 0 days
449 Starlit Way 4 3 2,570 $720,000 $280 66 days
437 Starlit Way 4 3 1,918 $710,257 $370 0 days
8001 East Bay Ct. 4 4 3,241 $699,999 $215 46 days
9182 Abingdon Dr. 4 4 2,310 $699,999 $303 203 days
801 Bluffview Dr. 3 4 3,434 $699,900 $203 4 days
405 Starlit Way 5 3 3,349 $699,900 $208 106 days
843 Indigo Bay Circle 4 4 3,392 $694,995 $204 154 days
736 Crystal Water Way 4 4 3,099 $689,900 $222 209 days
1221 East Isle of Palms Ave. 3 4 3,117 $674,900 $216 33 days
3021 Carmine Loop 5 3 2,578 $659,815 $255 0 days
987 Shipmaster Ave. 4 3 2,691 $654,900 $243 54 days
413 Seabury Ln. 4 3 2,476 $649,900 $262 28 days
962 Rugby Ct. 4 3 2,857 $613,063 $214 0 days
966 Rugby Ct. 3 3 2,857 $606,360 $212 45 days
970 Shipmaster Ave. 4 3 2,900 $599,900 $206 55 days
552 Walcott Dr. 4 3 3,050 $599,900 $196 107 days
515 Indigo Bay Circle 4 3 2,689 $599,000 $222 80 days
3258 Moss Bridge Ln. 5 4 3,206 $598,000 $186 21 days
5001 Azul Loop 4 3 2,684 $587,500 $218 19 days
586 Indigo Bay Circle 4 3 2,843 $575,000 $202 53 days
937 Rugby Ct. 4 3 2,590 $550,642 $212 0 days
5211 Mount Pleasant Dr. 4 3 2,512 $535,000 $212 2 days
262 Broughton Dr. 3 2 2,030 $519,900 $256 155 days
1620 Villena Dr. 5 3 3,156 $509,000 $161 110 days
Average: 3.8 3.2 2,699 $651,682 $233 61 days
Viewing 1 - 50 of 90
Sold Properties
Address Beds Baths Living ft2 List Price Sold Price Cost per ft2 DOM Sold Date
397 St. Julian Ln. 4 5 4,518 $1,899,000 $1,825,000 $403 64 days 10/6/26
429 Saint Julian Ln. 5 5 4,186 $1,875,000 $1,775,000 $424 96 days 5/20/26
505 Saint Julian Ln. 5 6 4,200 $1,799,900 $1,750,000 $416 174 days 10/6/26
197 Avenue of the Palms 5 4 3,737 $1,895,000 $1,725,000 $461 41 days 8/6/26
332 West Palms Dr. 6 6 4,354 $1,790,000 $1,700,000 $390 80 days 6/22/26
145 Avenue of the Palms 5 5 4,401 $1,875,000 $1,675,000 $380 102 days 8/7/26
842 Waterton Ave. 5 4 3,800 $1,799,900 $1,660,000 $436 72 days 10/8/26
1015 Bluffview Dr. 5 6 4,819 $1,525,000 $1,460,000 $302 71 days 8/25/26
485 Saint Julian Ln. 4 4 5,216 $1,585,000 $1,430,000 $274 110 days 6/22/26
320 West Palms Dr. 4 4 3,761 $1,475,000 $1,417,500 $376 86 days 6/18/26
424 West Palms Dr. 4 4 4,342 $1,399,000 $1,399,000 $322 141 days 9/18/26
464 West Palm Dr. 4 5 3,924 $1,550,000 $1,385,000 $352 134 days 9/4/26
1179 Fiddlehead Way 4 4 4,168 $1,425,000 $1,383,000 $331 90 days 7/2/26
1371 Rue De Jean Ave. 6 5 4,500 $1,336,000 $1,336,000 $296 0 days 4/30/26
317 St. Julian Ln. 5 4 3,410 $1,395,000 $1,310,000 $384 320 days 6/22/26
946 Fiddlehead Way 5 5 4,710 $1,359,000 $1,305,000 $277 98 days 5/15/26
1080 Fiddlehead Way 5 4 5,120 $1,375,000 $1,300,000 $253 91 days 5/20/26
434 Seabury Ln. 6 6 4,173 $1,250,000 $1,287,500 $308 56 days 8/7/26
336 W Palms Dr. 4 5 3,400 $1,349,900 $1,282,500 $377 145 days 9/24/26
329 Shoreward Dr. 4 6 4,296 $1,298,000 $1,268,000 $295 60 days 9/28/26
425 Saint Julian Ln. 4 5 3,691 $1,350,000 $1,250,000 $338 42 days 6/26/26
3004 Bellfield Ct. 5 3 4,100 $1,299,999 $1,247,500 $304 181 days 9/15/26
825 Bluffview Dr. 5 5 3,720 $1,275,000 $1,240,000 $333 125 days 9/9/26
1163 East Isle of Palms Ave. 4 5 3,538 $1,475,000 $1,200,000 $339 49 days 9/10/26
8172 Wacobee Dr. 5 3 3,866 $1,400,000 $1,195,000 $309 77 days 7/1/26
925 Shipmaster Ave. 4 5 3,933 $1,275,900 $1,185,000 $301 127 days 6/25/26
9017 Loggerhead Ct. 4 4 3,623 $1,175,000 $1,175,000 $324 33 days 9/28/26
9445 Carrington Dr. 5 6 4,196 $1,200,000 $1,160,000 $276 32 days 5/18/26
692 Waterbridge Blvd. 3 3 3,886 $1,199,000 $1,125,000 $289 63 days 10/20/26
5020 Middleton View Dr. 5 4 3,410 $1,149,000 $1,125,000 $329 54 days 7/15/26
512 Starlit Way 6 5 3,832 $1,135,000 $1,100,000 $287 60 days 8/4/26
6017 Fish Hawk Ct. 5 7 5,712 $1,139,500 $1,070,000 $187 220 days 9/10/26
8609 Caldee Ct. 5 5 4,500 $1,200,000 $1,060,000 $235 56 days 7/16/26
9429 Carrington Dr. 6 5 4,531 $1,100,000 $1,050,000 $231 125 days 9/21/26
2079 Summer Rose Ln. 5 5 3,980 $1,040,000 $1,040,000 $261 1 day 8/3/26
528 Walcott Dr. 5 4 4,446 $1,069,900 $1,040,000 $233 185 days 8/31/26
185 Avenue of the Palms 4 3 2,672 $1,099,900 $1,030,000 $385 233 days 6/10/26
2036 Summer Rose Ln. 5 5 3,999 $1,020,000 $1,020,000 $255 22 days 9/24/26
9046 Belvedere Dr. 5 4 3,821 $1,020,000 $1,020,000 $266 0 days 8/31/26
1704 Singing Rose Dr. 5 5 3,898 $999,000 $999,000 $256 69 days 5/12/26
684 Waterbridge Blvd. 5 5 3,620 $999,900 $990,000 $273 68 days 6/9/26
2075 Summer Rose Ln. 6 4 4,213 $995,000 $965,000 $229 48 days 6/16/26
1086 East Isle of Palms Ave. 6 4 3,873 $974,000 $965,000 $249 164 days 5/18/26
9022 Belvidere Dr. 5 4 3,873 $950,000 $950,000 $245 0 days 9/21/26
9015 Belvidere Dr. 5 5 4,399 $995,000 $940,000 $213 123 days 7/13/26
247 Welcome Dr. 4 4 3,107 $975,000 $939,500 $302 77 days 9/1/26
678 Waterbridge Blvd. 4 4 3,116 $935,000 $935,000 $300 73 days 8/20/26
522 Cedar Grove Ln. 6 4 3,682 $949,900 $930,000 $252 328 days 8/24/26
409 Seabury Ln. 5 5 3,283 $919,900 $927,000 $282 68 days 10/14/26
1308 Ashboro Ct. 4 4 3,487 $950,000 $925,000 $265 303 days 10/9/26
Average: 3.8 3.1 2,533 $574,205 $558,821 $215 99 days
Viewing 1 - 50 of 469, only 250 can be displayed.

Provided courtesy of The Coastal Carolinas Association of REALTORS®. Information Deemed Reliable but Not Guaranteed. Copyright 2026 of the Coastal Carolinas Association of REALTORS® MLS. All rights reserved. Information is provided exclusively for consumers’ personal, non-commercial use, that it may not be used for any purpose other than to identify prospective properties consumers may be interested in purchasing.

How much is your Myrtle Beach home worth?

...get instant property value now!